
Figure 2. Frequency Trend of Two Buffering Genes.
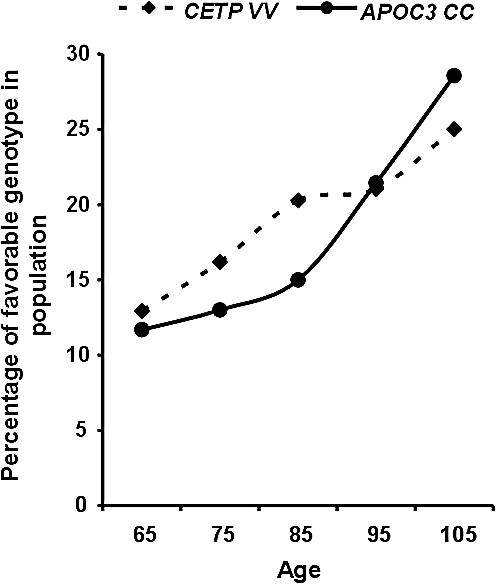
Longevity genes are expected to exhibit monotonic increase in their favorable genotype when sampled in progressively older age groups. The graph shows a highly significant (p < 0.0006) monotonic increased frequency across ages for favorable genotypes in APOC-3 CC, and a significant (p < 0.047) for CETP-VV, fulfilling our definition for candidate longevity genes.