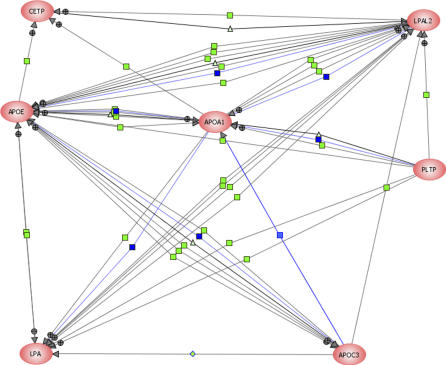
Figure 6. Protein–Protein Interaction Network.
Protein–Protein interaction networks of subsets of proteins relevant to the buffering hypothesis analysis. Connecting lines between gene symbols indicate interactions; different types of interactions are denoted by symbols on the lines. Green square, regulation; blue square, expression; light green triangle, transport; + in grey circle, positive effect; − in grey circle, negative effect. CETP interacts with LPA through LPAL2, an LPA-like 2 protein. This interaction is also mediated by LPAL2 through APOA1, and apolipoprotein A-I. Also, though our analysis shows no interaction between LPA and APOC-3, pathway analysis shows a direct interaction, suggesting additional and non-overlapping functionality between CETP and APOC-3 (see text).

