
Figure 2.
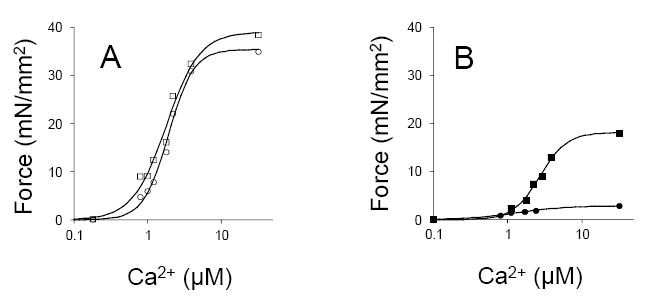
Representative F:Ca relationships in cell fragments obtained from tissue that had undergone extensive cardioplegia and sarcomeric protein dephosphorylation (panel A, on the left) and fragments from tissue that had been fast frozen in the presence of phosphatase inhibitors to preserve the endogenous phosphorylation state (panel B). The square symbols are cells that were isolated from ostensibly normal myocardium whereas the circles indicate cells that were isolated from non-ischemic severely myopathic tissue.