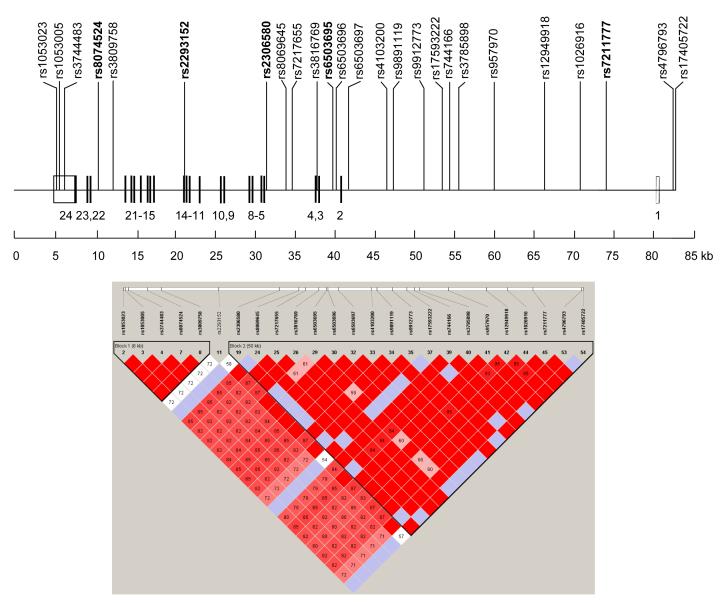
Fig. 1.
Linkage disequilibrium plot of STAT3 region HapMap SNPs
On gene map, numbers refer to exons, with coding exons as solid boxes and untranslated exons as open boxes. tSNPs are shown in bold type. Note reverse strand orientation. Genotype data for SNPs of MAF>0.05 in the region Chr17:40835507 – 40918677 in 90 CEU subjects were downloaded from http://www.hapmap.org (Phase II HapMap Release January 2006). The pairwise LD plot (r2) was obtained using the integral Tagger program. SNP rs2293152 lies between two blocks and does not tag any other common SNPs in this gene.

