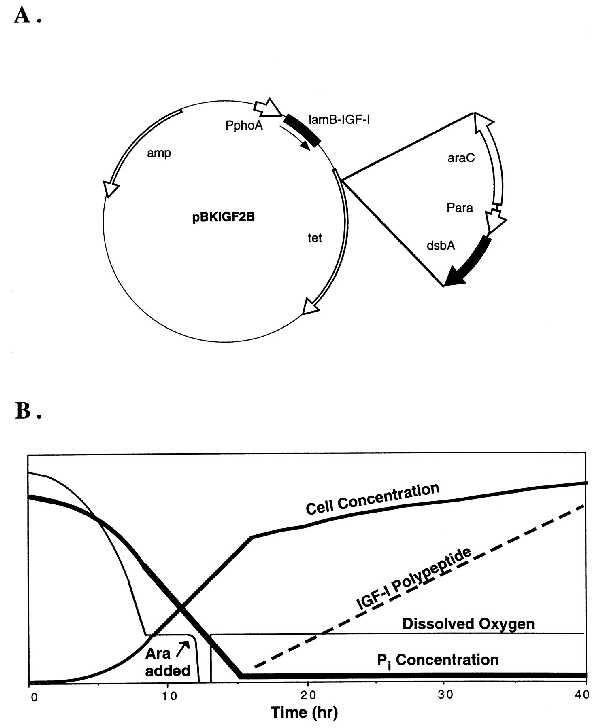
Figure 1.

Plasmid schematic and fermentation profiles. The plasmid construction for pBKIGF2B and the modification are depicted (A). The idealized fermentation protocol for the production of rhIGF-I is shown (B). The arrow denotes the approximate time of l-arabinose addition (10–12 h). The thick solid line represents the inorganic phosphate concentration. The medium solid line represents the cell concentration, and the thin solid line represents the dissolved oxygen concentration. The dashed line represents the IGF-I polypeptide concentration. The y axis is in arbitrary units.
