Figure 2.

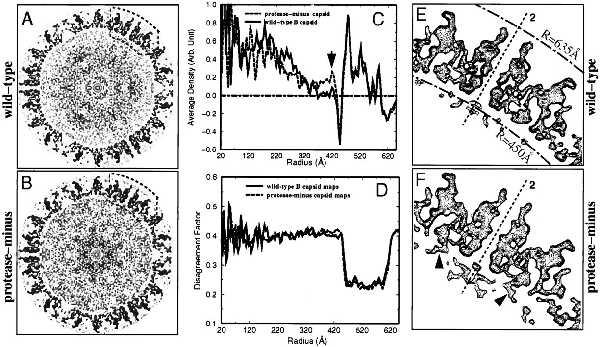
Comparison of the outer shells and internal cores of wild-type and protease-minus capsid reconstructions. One central, 4.67-Å thick section traversing twofold axes and Tb triplexes was extracted from wild-type (A) and protease-minus (B) capsids. (C) The densities at the same radius were averaged to show the density distribution as a function of radius for the wild-type (solid curve) and protease-minus (dotted curve) capsid reconstructions. The arrow indicates an additional density peak close to the capsid shell of protease-minus capsids. (D) Disagreement factor (defined as 2 |D1 − D2|/(D1 + D2), where D1 and D2 represents density values in two independent reconstructions, 1 and 2, of each capsid type) was calculated as wild-type (solid line) and protease-minus (dashed line) capsids. The regions enclosed by dashed boxes in A and B are enlarged and shown as contour plots of E and F, respectively. A twofold axis is indicated by dashed lines. Two radial distances from the center of the capsid (R = 450 Å and 635 Å) are marked by dot-dashed arcs in E. Arrowheads in F designate additional rod-like densities present in the protease-minus capsid.
