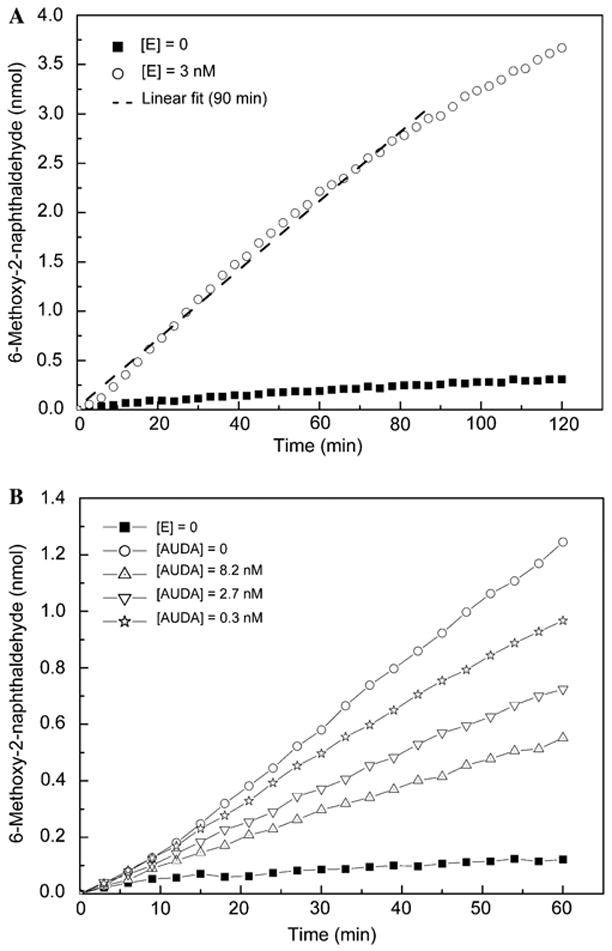
Fig. 2.

Time course of 6-methoxy-2-naphthaldehyde concentration for optimized endpoint assay conditions: [E]final (HsEH) = 3 nM; [S]final (PHOME) = 50 μM; 25 mM BisTris–HCl buffer (pH 7.0) containing 0.1 mg/ml BSA; 200 μl assay volume. (A) Normalized 2-h monitoring of the enzymatic reaction in comparison with autohydrolysis of the substrate. The dashed line is the linear regression of the first 90 min of the enzymatic reaction (r2 = 0.994). (B) Impact of three different concentrations of AUDA, an sEH inhibitor, on the substrate turnover rate as well as maximal (noninhibited) and minimal (autohydrolysis) enzyme activities.
