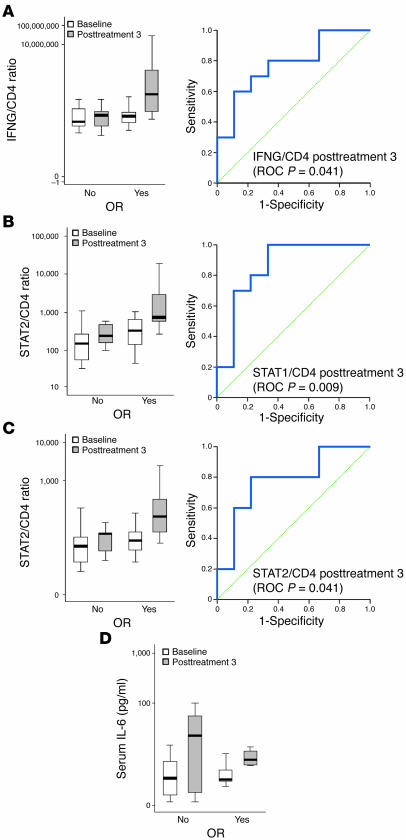
Figure 6. Expression of the genes involved in innate immune response to adenoviral vectors.
(A–C) Expression of the genes involved in type I and II IFN signaling that have value in prediction of OR. The left panel shows a box plot that represents the summarized expression of the respective gene in baseline and posttreatment 3 samples (y axis) normalized to CD4 and are grouped with respect to OR (x axis). Right panel represents the ROC curve generated for the expression of the respective gene at posttreatment 3. For each gene, the P value of area under the curve statistic is shown in parentheses. (D) IL-6 concentration in patients’ sera. Values are summarized and shown as box plots that represent serum IL-6 values as pg/ml (y axis) and are grouped according to status of the OR (x axis). For a description of the box plot parameters, see Figure 4.

