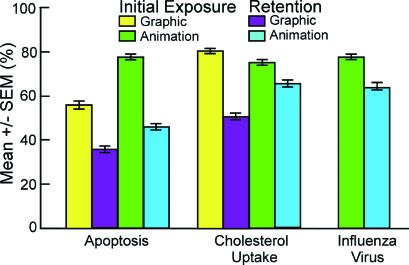
Figure 2.
Questionnaire results for initial and retention analysis. Students who viewed the apoptosis graphic and animation were tested immediately (initial exposure: graphic and animation) and 21 d later (retention: graphic and animation). Similarly, students who viewed the cholesterol uptake graphic and animation were tested immediately (initial exposure: graphic and animation) and 21 d later (retention: graphic and animation). A single group that viewed the influenza virus animation was tested immediately (initial exposure: animation) and after 21 d (retention: animation). The mean ± SEM were calculated for the total marks resulting from student answers to the specific questions in part II of the questionnaires (see Supplemental Material 2–4 for the specific questions).

