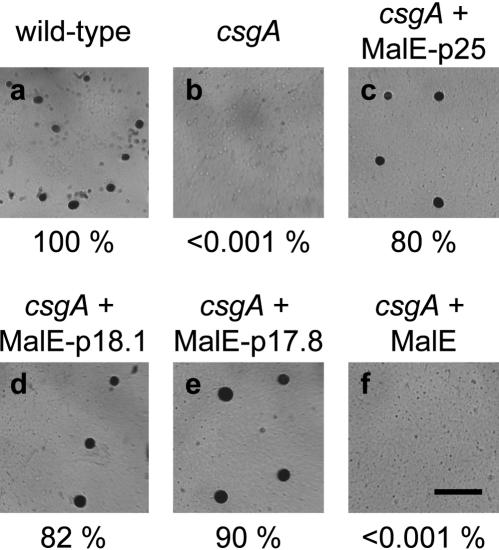
Figure 4.
C-signal activity of MalE–p25, MalE–p18.1, and MalE–p17.8. Wild-type (DK1622, a) and csgA cells (DK5253, b) developed in submerged culture in A50-starvation buffer are shown together with csgA cells (DK5253) developed in the presence of one unit (corresponding to a final concentration of 2 μM) of MalE–p25 (c), MalE–p18.1 (d), or MalE–p17.8 (e). MalE protein was added to a final concentration of 2 μM (f). Fruiting bodies and spores were scored after 72 h of development. Sporulation frequencies are shown below each panel and are presented relative to the level of sporulation in DK1622, which had an absolute sporulation frequency of 0.96%. Bar, 0.5 mm.

