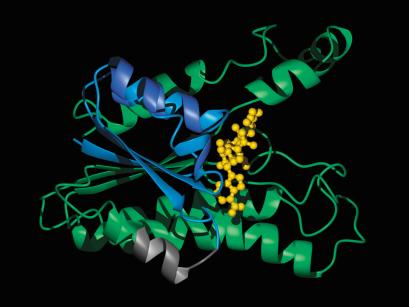
Figure 7.
Homology model of p25. Residues 1–59 are colored blue, the predicted cleavage site of p25 located between residues 60–68 is colored gray, residues 69–229 are colored green. The NAD+ molecule is shown in yellow. The illustration was prepared with the program MOLMOL, version 2k.2 (Koradi et al. 1996) and the POV-Ray rendering program (http://www.povray.org).

