
Figure 7.
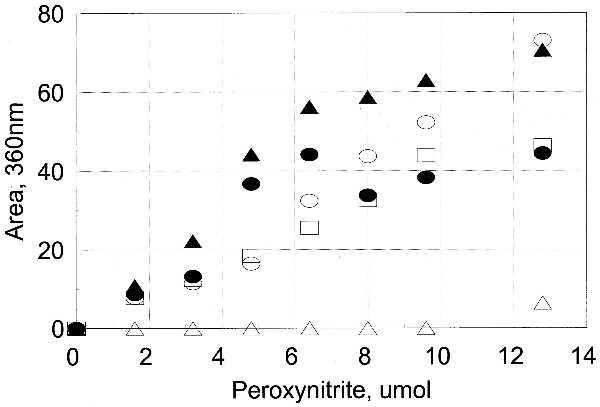
Susceptibility of individual tyrosine residues of GS12 to nitration. The area of the nitrated peaks for those tyrosines that were susceptible to nitration (Table 2) was obtained from the HPLC peptide map as described in the text. A single peptide contained both Tyr-287 and Tyr-296, which were both shown by simultaneous sequencing to be rapidly nitrated, so the area for that peptide was divided by 2 before plotting. •, Tyr-326; ▴, Tyr-287/Tyr-296; □, Tyr-114; ○, Tyr-100; ▵, Tyr-179.