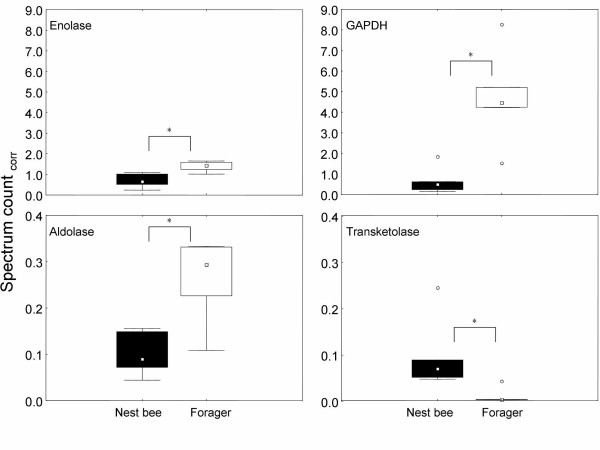
Figure 2.
Box-and-whisker-plots of selected proteins associated with glucose processing Boxes represent 25–75% percentiles of the data, outliers are marked as open circles. * denotes significant differences between nest bees and foragers, for p-values see Additional file 1. Aldolase: fructose-1-6-bisphosphate aldolase, GAPDH: glyceraldehyde-3-phosphate-dehydrogenase. Spectrum countcorr: spectrum count corrected for actin.

