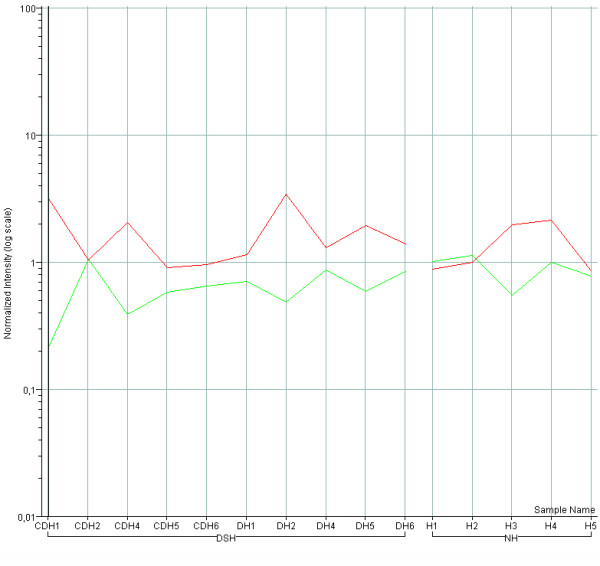
Figure 4.

Expression level of DSCR1 and NFATC3 genes in individual heart samples. Microarray expression values of DSCR1 (red line) and NFATC3 (green line) genes of individual trisomic hearts (CDH1, CDH2, CDH4, CDH5, CDH6 and DH1, DH3, DH4, DH5, DH6) and individual normal hearts (H1, H2, H3, H4, H5) show an inverse correlation (r = -066) between the two genes.
