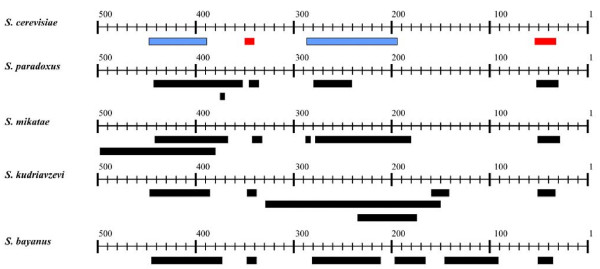
Figure 5.
Schematic of the arrangement of uORFs in the 5' flank of S. cerevisiae YJL139c (YUR1) and its homologues in other Saccharomyces species. This type of diagram is produced automatically for each gene, showing the intergenic sequence as a numbered axis; the coding sequence of the gene starts at the position one of the intergenic sequence. uORFs are shown as boxes. The box colours show S. cerevisiae uORFs predicted to be functional (red), or not functional (blue). uORFs from other species are represented by black boxes, since we do not predict their functionality. The rightmost uORF (uORF1) is identical to the one shown in Fig. 4.

