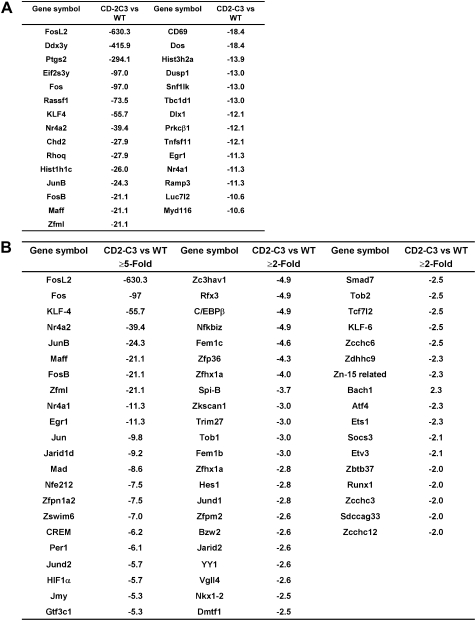
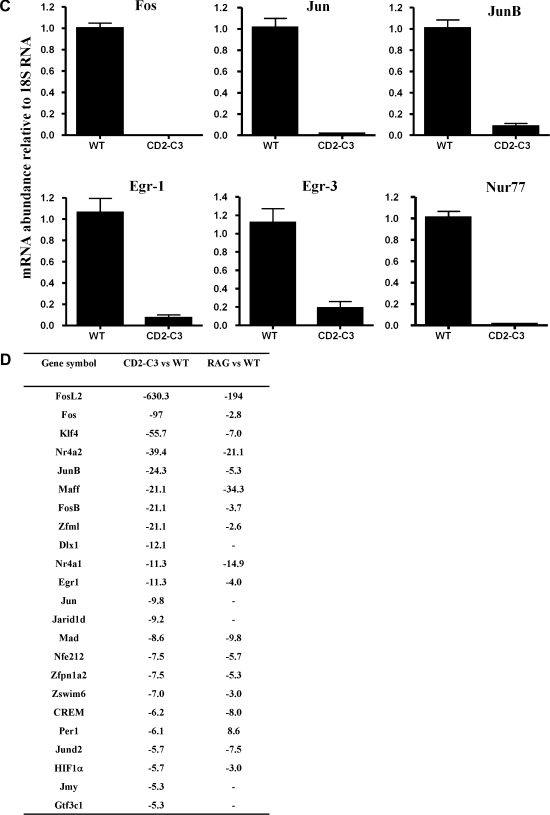
Fig. 2.
Transcriptional changes caused by loss of endogenous RhoA function in DN3 pre-T cells. (A) Table showing the diverse number of genes that display a 10-fold or greater reduction in expression in CD2–C3 DN3 cells compared to wild type DN3 cells. The symbol (–) preceding the numerical value indicates a fold decrease. (B) The table displays total number of transcription factors that display a 2-fold or greater reduction in expression in CD2–C3 DN3 thymocytes compared to wild type DN3 cells. (C) Real time PCR analysis of several transcription factor genes downregulated in CD2–C3 DN3 cells compared to wild type DN3 cells. Error bars indicate the standard deviation obtained from three independent experiments. (D) Table showing comparison of transcription factors downregulated in RAG2−/− DN3 cells with CD2–C3 DN3 cells.


