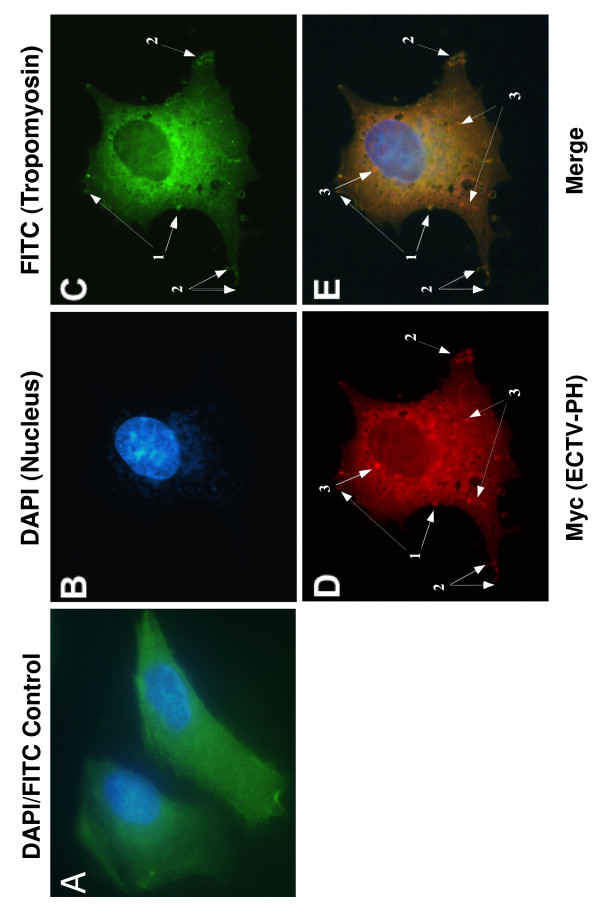
Figure 11.
Investigation of colocalization of ECTV-PH and cellular tropomyosin by immunofluorescence. Myc-tagged ECTV-PH was overexpressed in virus-infected BS-C-1 cells using a vTF7-3 transient expression system. (A) Mock-infected control cells stained with anti-tropomyosin antibodies and visualized with FITC (green) show a relatively uniform distribution of endogenous tropomyosin throughout the cytoplasm. DAPI staining (blue) shows the cellular nuclei. See Figure 9A for the corresponding anti-Myc control. (B) DAPI staining shows the cellular nucleus and viral DNA (blue). (C) Endogenous tropomyosin (green), and (D) ECTV-PH (red) are both distributed throughout the cytoplasm but colocalize to structures resembling actin tails (arrows labelled 1) and to protrusions from the cell surface (arrows labelled 2). ECTV-PH also localizes in high concentrations to structures resembling inclusion bodies formed by truncated ATI proteins (presumably from the recombinant vaccinia used to infect the cells (arrows labelled 3)). (E) Merged view of panels (B-D) showing colocalization of tropomyosin and ECTV-PH to structures at the cell periphery as described above, indicated by arrows 1 and 2. Arrows labelled 3 indicate putative inclusion bodies, as described above.

