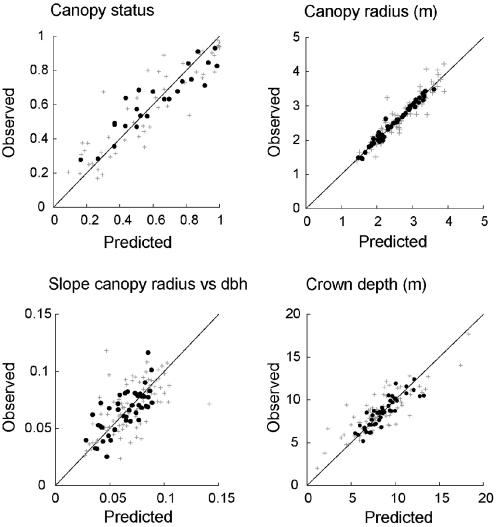
Figure 3. Observed vs predicted average crown metrics for the 75 US tree species with at least 100 measurements of observed canopy status (top left), and the 135 species with at least 30 measurements of observed crown radius and crown depth (remaining panels).
The most common third of the species in each panel are shown in black, with remaining species in grey. Predictions are from implementing the ITD model for each FHM forest inventory plot. The parameter estimation allowed two free parameters for each species j. Observations for species j were generated by averaging all available canopy status data for j, and all available crown radius and crown depth measurements for canopy trees of species j. Slope refers to slope from a least-squares linear regression of either observed canopy radius vs dbh, or predicted canopy radius vs dbh.

