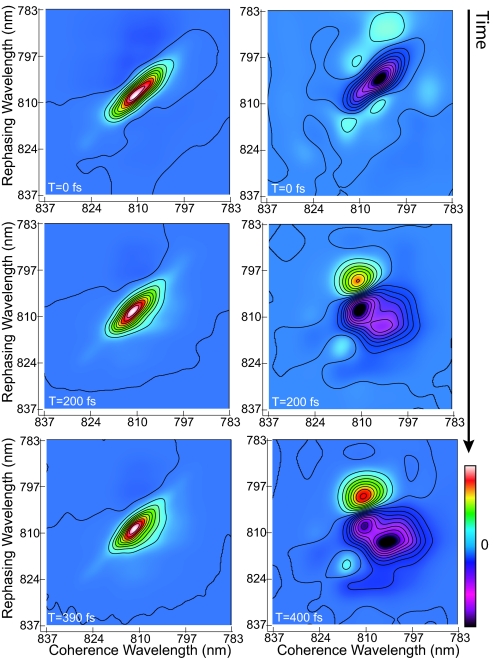
Fig. 1.
The evolution of the 2D electronic spectrum of P. phaeum FMO is shown. In the conventional 2D spectra (Left), the emergence of cross-peaks below the main diagonal is evidenced by the contour lines bowing away from the diagonal by 200 fs. In the cross-peak-specific spectra (Right), the emergence of the negative features below the main diagonal corresponds to the cross-peaks largely obscured in the conventional 2D spectra.

