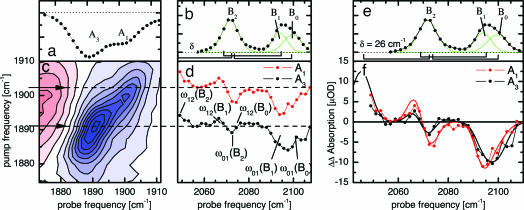
Fig. 5.
2D-IR spectroscopy of sw-MsCO-V68Y. (a) Time-resolved IR spectrum of sw-Mb13CO-V68Y, 5 ps after 540-nm excitation. (b) Time-resolved IR spectrum of the 13CO ligand in the primary docking site B, 5 ps after 540-nm excitation. B2, B1, and B0 populations are observed. The square brackets at the bottom indicate the expected ω12 frequencies of the B2, B1, and B0 substates. (c) 2D-IR spectrum of the A states. (d) Cuts through the T2D-IR-EXSY cross-peaks between heme-bound CO (A1 and A3) and CO in the docking site (B2, B1, and B0). The IRpump energies correspond to the respective arrows in c. (e) The same as b for orientation in f. (f) Overlay of the cross-peak cuts shown in d. The solid lines are calculated spectra.

