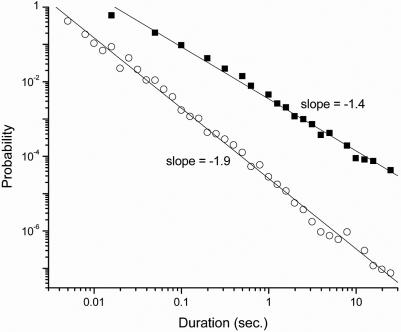
Fig. 2.
Probability density of duration of blinking periods for the time trace shown in Fig. 1, using 5-msec time bins. Filled squares indicate dark periods, and open circles indicate bright periods. The absence of points for short bright periods is due to the limited statistics for the finite duration of this data run.

