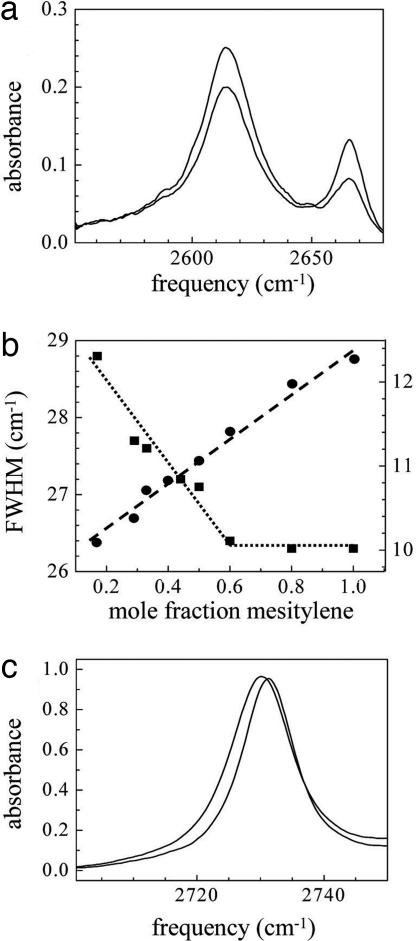
Fig. 1.
Linear spectroscopy. (a) Spectra of the OD stretch of phenol-OD in the mixed solvent mesitylene/CCl4 at two mole fractions. Lower frequency peak: T-shaped phenol-mesitylene complex. Higher frequency peak: free phenol (uncomplexed). The spectrum with the larger amplitude lower frequency peak has a mesitylene mole faction (χ) of 0.44, and the other spectrum has χ = 0.17. (b) Line widths as a function of mole fraction for the phenol-mesitylene complex OD stretch (squares, left axis) and a mesitylene band in the mixed solvent without phenol (circles, right axis). The line through the squares is an aid to the eye. The line through the circles is the best linear fit. (c) The mesitylene band in the mixed solvent at two mole fractions. The lower frequency peak is for a mesitylene mole fraction of 1 and the higher frequency peak is for a mole fraction of 0.17. Note that the shift in peak position is ≈1 cm−1.

