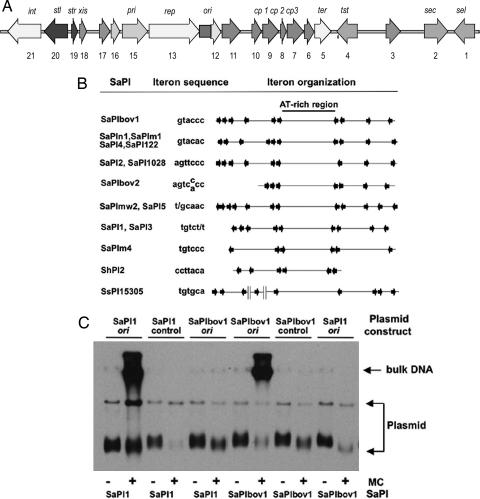
Fig. 1.
Identification of the SaPI replication origins. (A) Map of SaPIbov1. Arrows represent the localization and orientation of the different ORFs, with labels indicating known gene functions. No functions have been identified for ORFs 3, 6, 10, 11, 12, 16, and 17, which have no significant matches in the database. (B) Comparative map of the replication origins of several SaPIs. The iterons are represented by arrows, and their sequences are shown at left. Note that there are always two sets of iterons flanking an AT-rich region, which could be the melting site. (C) The sequences containing the iterons of SaPIbov1 or SaPI1 were cloned into the thermosensitive plasmid pBT2. Sequences not containing iterons of each island were cloned as controls. The resulting plasmids were introduced into 80α lysogens carrying SaPI1 or SaPIbov1. Bacterial cultures of the different strains were exposed to MC, then incubated in broth at 43°C (restrictive temperature for pBT2 replication). Samples were removed 90 min after MC induction. Standard minilysates were prepared, separated by agarose gel electrophoresis, and blotted by using a pBT2-specific probe.

