Fig. 3.
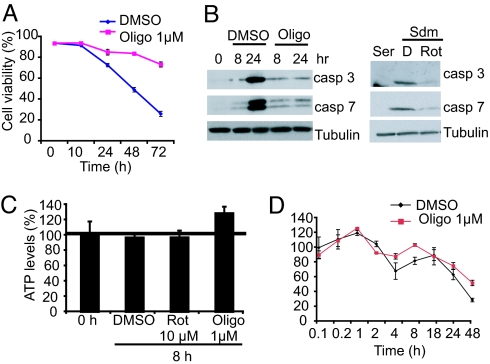
Mitochondrial inhibitors suppress caspase 3 and 7 activation without decreasing ATP levels. (A) Time course of cell death rescue by oligomycin (Oligo). N548 mutant cells were treated with DMSO or oligomycin (1 μM) and analyzed by trypan blue viability assay. A total of 1,000 cells were counted per time point. The data are means ± SD of one experiment performed in triplicate. (B) Caspase (casp) 3 and 7 activation in serum-deprived cells treated with DMSO (D) or oligomycin (left gels) and rotenone (Rot) (right gels) was assayed by Western blotting. Tubulin was the loading control. (C) Cells were treated with different mitochondrial inhibitors or DMSO, and total ATP levels were assayed after 8 h in Sdm by using a luminescence-based assay (see Materials and Methods). ATP levels were normalized to cell number and expressed relative to untreated cells at 0 h, set as 100% in all experiments. All experiments were performed in triplicate, and the data are shown as means ± SD. The horizontal bar shows ATP levels in untreated controls. (D) Time course of ATP levels in DMSO and oligomycin-treated mutant cells. The data are means ± SD of an experiment that was performed in triplicate and is representative of three independent experiments. The data were normalized to ATP levels of DMSO-treated cells at 0.1 h that were arbitrarily set as a 100%.

