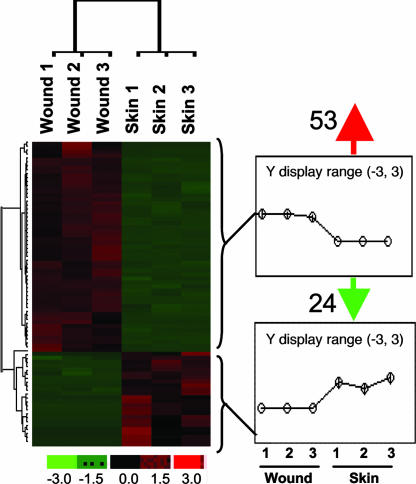
Fig. 4.
Hierarchical cluster images illustrating genes up- or down-regulated in vessels from human wound edge compared with that from intact skin. Gene expression data obtained by using GeneChip were subjected to t test analysis with false discovery rate correction (see SI Fig. 8). For comparative visualization, those genes that were expressed at significantly different levels in the wound-edge skin versus the intact skin were subjected to hierarchical clustering as shown. Line graphs at Right illustrate the average pattern of gene expression in the corresponding cluster. Red to green gradation in color represent higher to lower expression signal. A scale representing fold change is indicated at the bottom.

