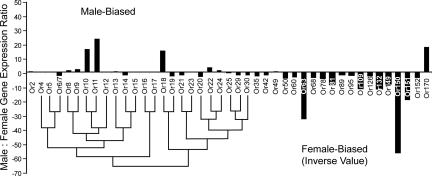
Fig. 3.
Three of the four candidate sex pheromone receptors group closely together in the honey bee phylogenetic tree. Drone-to-worker ratio of AmOr genes (n = 43) expressed in antennae, determined by qPCR. AmOr2, -4, -5, -6/-7, -8 to -25, -29, -30, -35, -42, -49, -50, -60, -63, -68, -78, -81, -89, -95, -109, -126, -132, -149 to -152, and -170 are depicted sequentially on the x axis. Cycle threshold (CT) values for each gene expressed in drone and worker antennae were normalized to the control gene AmRPS8 before calculating the drone-to-worker ratio (y axis). The phylogenetic relationships of AmOr4–30 are represented by a neighbor-joining tree as described in ref. 25.

