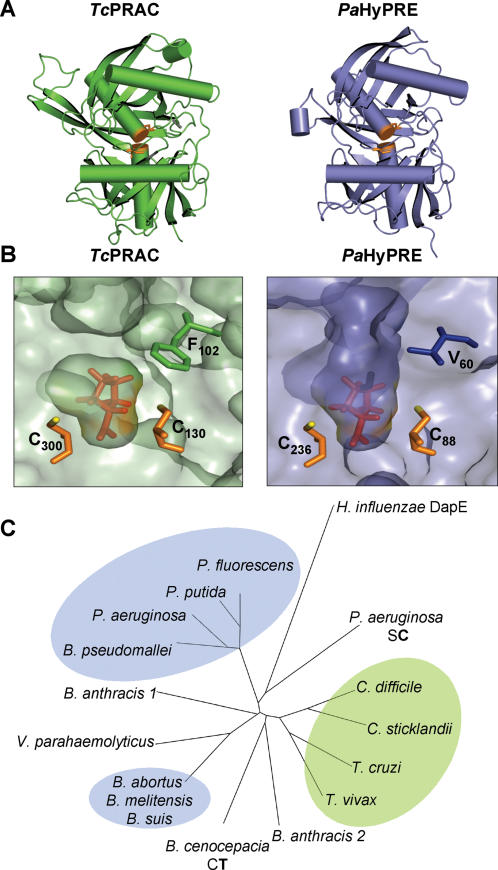
Figure 7. PRAC and HyPRE structural data, pocket constraints and evolution.
(A) Ribbon model of TcPRAC (green, PDB : 1W61) and PaHyPRE (purple, PDB : 2AZP) subunits revealing the overall similarities of the 3D-structures. Cys catalytic residues (orange). (B) Close view of TcPRAC (left panel) and PaHyPRE (right panel) pockets. The two catalytic Cys residues of PRAC (C130 and C300) and of HyPRE (C88 and C236) are shown in the reaction center colored in orange sticks. Hydrophobic F102 (green sticks) and aliphatic V60 (blue sticks) residues are depicted respectively in PRAC and HyPRE reaction centers where Pro and OH-Pro were modeled. Polarity hindrance imposed by the aromatic PRAC F102 residue and the solvent accessible area for the ligand made possible by HyPRE V60 residue are shown. (C) Phylogram of PRAC and HyPRE aligned sequences showing the unrooted tree using H. influenzae DapE as uncontroversial outgroup. Bacterial and protozoa PRAC cluster together suggesting that divergence of PRAC and HyPRE took place before the separation of bacteria and eukaryotes.

