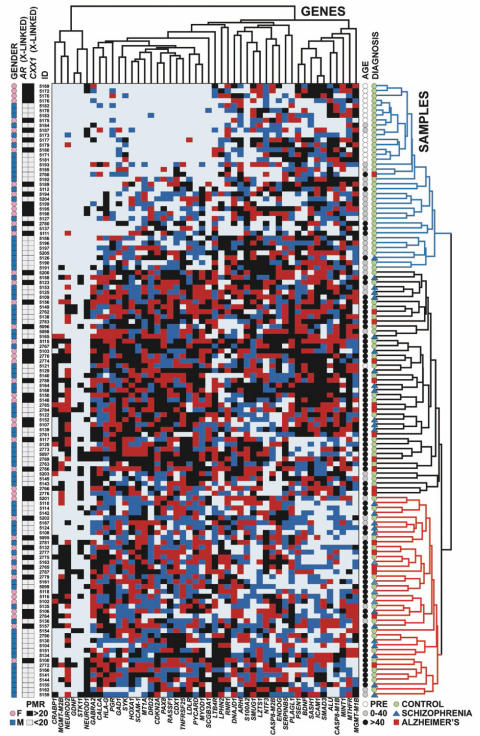
Figure 1. DNA methylation changes at 50 loci in temporal neocortex across the lifespan.
Two dimensional hierarchical cluster analysis using Manhattan distance and average linkage (N = 48 regions, 125 subjects). DNA (rostro-lateral temporal neocortex) was extracted and analyzed by MethyLight for the genes indicted as described (see Methods). Each gene is grouped into quartiles (Dark Light Blue = 1 low, Dark Blue = 2 medium-low, Red = 3 medium high, Black = 4 high extent of methylation). The larger the number of samples with no detectable methylation, the fewer the number of observations coded dark blue and red. Gender (Blue squares = Male, Pink circles = Female), Age (White circles = Prenatal (PRE); Gray circles = 0–40 years old; Black circles = older than 40 years), and Diagnosis (Green circles = controls; Blue triangles = Schizophrenia cases; Red squares = Alzheimer's cases) are indicated with symbols explained below each variable. AR and FAM127A are two additional X-linked genes with DNA methylation occurring on the inactive X-chromosome in females, and are dichotomized at a PMR value of 20, as indicated. PMR = Percent of Methylated Reference [23], [55]. Three major sample clusters are indicated on the right hand side in blue (consisting mostly of prenatal and young adult samples), black, consisting mostly of subjects over 40 years old with high density CpG island methylation, and red, mostly subjects over 40 years old with lower density CpG island methylation.

