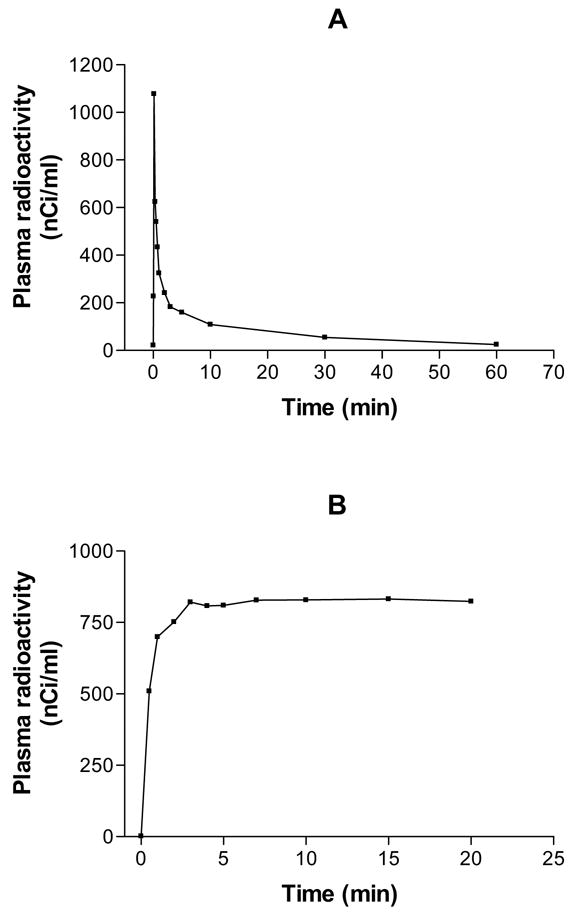
Figure 1.

Examples of 14C-labeled sucrose plasma profiles after intravenous bolus injection (A) and step-down infusion (B). Notice the sharp rise and the steep fall in plasma levels in A and the sharp rise, but relatively constant plasma levels thereafter in B. Identical administration protocols were employed for MRCA injection in the present work.
