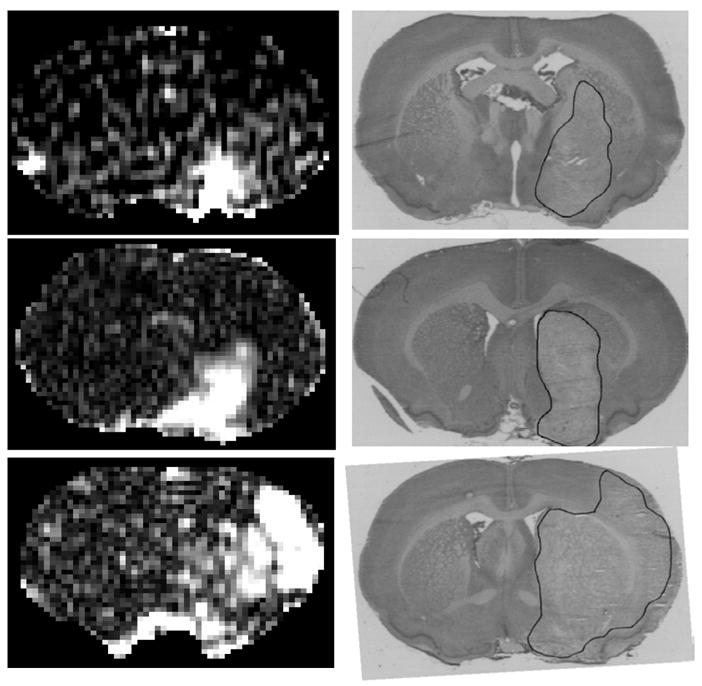
Figure 4.

Three examples of MR images after Gd-DTPA enhancement observed after a typical step-down infusion (left set of panels) and of the histologies obtained from within the MRI slices (right set of panels). The pre-Gd-DTPA T1WI images were subtracted from the post-Gd-DTPA T1WI images to highlight the enhancing areas. The ischemic lesion seen on the Nissl stained sections from the respective experiments are outlined in black on the histological images on the right. It can be seen in the MR subtracted maps that the MR contrast images are relatively smooth. The S/N ratio appears to be quite high from the step-down infusion studies, and the identification of the enhancing regions is simple and straightforward from these images. Blood-brain barrier opening was, thus, readily detectable from the Gd-DTPA distribution data from the step-down infusion studies.
