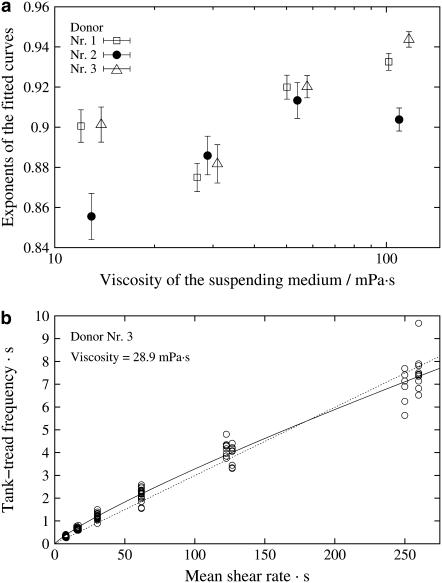
FIGURE 4.
Curvature of the functional behavior of f vs.  (a) Semilogarithmic plot of the exponents of the fit function versus η0. Exponents below unity indicate a convex curvature. The data of donor Nr. 1 and 3 (open symbols) are shifted horizontally for clarity. (b) Example of a curve in a linear plot. (Circles) Experimental data; (solid line) exponential fit function; (dashed line) pragmatic choice of a linear approximation; for details see text.

