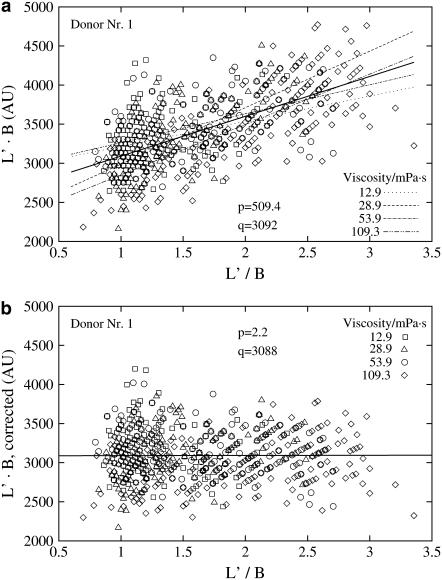
FIGURE 6.
L′B vs. L′/B for donor Nr.1. Broken lines indicate linear regressions for each viscosity. The solid line indicates the regression for all viscosities. The slope (p) of the solid line and its value (q) at L′/B = 1 are indicated. (a) Primary data; (b) after a correction, that compensated for the increase of L′B with L′/B.

