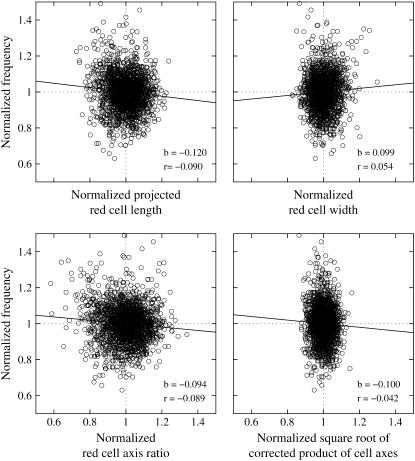
FIGURE 8.
Scatter plots of f versus four morphological parameters: L′, B, L′/B, and  The primary data were normalized by the mean value of the respective condition (circles). Linear regressions are shown as solid lines. The values of the correlation coefficients (r) and the slopes of the regression lines (b) are indicated.

