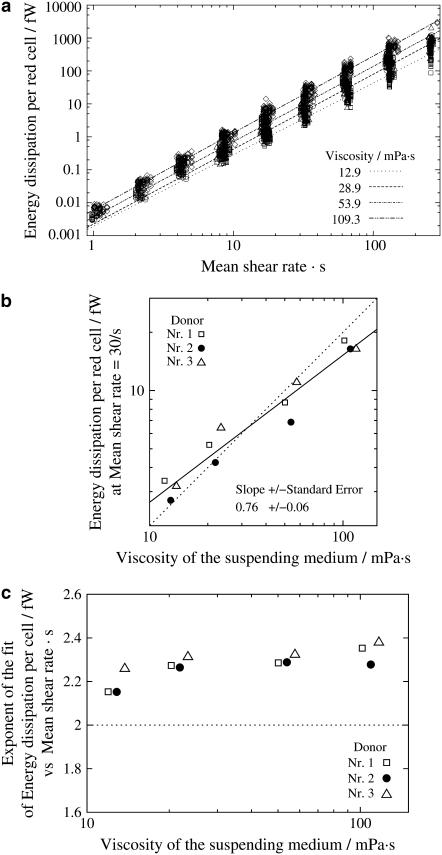
FIGURE 9.
Energy dissipation in the membrane of tank-treading red cells. (a) Logarithmic plot of the energy dissipation versus  Single cell values (symbols as in Fig. 6); regressions (lines). (b) Logarithmic plot of the ordinate values of the regression lines in Fig. 9 a at
  versus η0. The mean ± SE is about the size of the symbols. The data of donor Nr. 1 and 3 (open symbols) are shifted horizontally for clarity. The data were fitted linearly in this logarithmic plot (solid line). The dotted line with slope = 1 corresponds to the undisturbed flow. (c) Semilogarithmic plot of the slopes of the regression lines in Fig. 9 a versus η0. The mean ± SE is about the size of the symbols. The data of donor Nr. 1 and 3 (open symbols) are shifted horizontally for clarity. The horizontal line (dotted) corresponds to the undisturbed flow.

