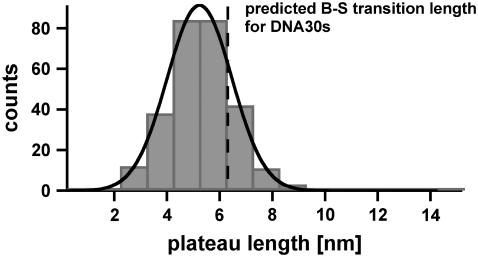
FIGURE 6.
Histogram of the plateau lengths of DNA30s. The histogram (FWHM = 3.4 nm) contains ∼280 rupture events and shows the corresponding plateau lengths, which refer to the B-S transition. The histogram was fitted with a Gaussian curve (black) and yielded a most probable value of 5.2 nm. The theoretically predicted value equals 6.3 nm, which is compatible with the measurements within an overlap probability of 66.5%. The smaller experimental value is most likely due to melting of the DNA duplex during the B-S transition.

