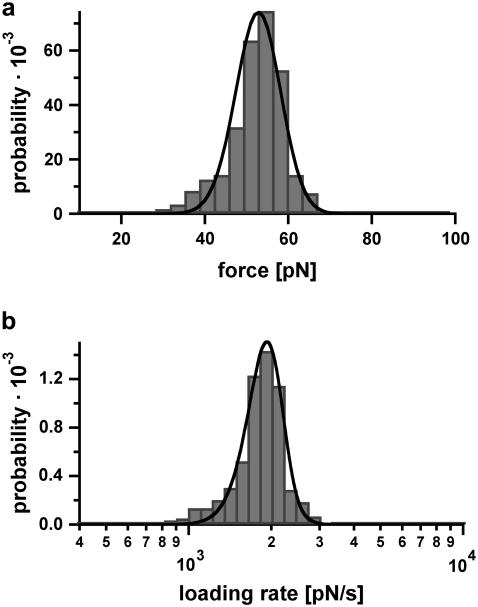
FIGURE 8.
Example of the measured rupture force and loading rate distributions for the 20-basepair duplex. (a) Histogram of the unbinding forces of DNA20s. The histogram (FWHM = 13.9 pN) contains ∼350 rupture events. More than 97% of the rupture events occur at forces smaller than the B-S transition of 65 pN. The histogram is fitted with the calculated probability density function p(F) (black) with Δx = 2.7 nm and koff = 6 × 10⁻¹³ s−1. To consider the detection noise, the probability density function was convolved with a Gaussian distribution. The standard deviation of the Gaussian distribution equals the typical noise value of the cantilever, which was used (5.0 pN). (b) Histogram of the loading rates of DNA20s. The obtained loading rate distribution, plotted logarithmically, is compared with the calculated probability density function  (black).

