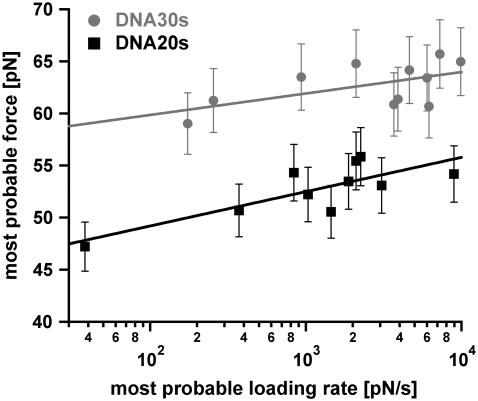
FIGURE 9.
Diagram showing the most probable rupture force plotted against the appropriate most probable loading rate (pictured logarithmically) for DNA30s and DNA20s. The data points were gained from the Gaussian fits of the rupture force histogram and the histogram of the loading rates, plotted logarithmically. The gray data points (circles) refer to the measurements with DNA30s, the black data points (squares) correspond to DNA20s. These respective data points are fitted with a straight line according to the loading-rate-based analysis method. The values for Δx and koff are obtained from Eq. 1. For DNA30s the values are Δx = (4.63 ± 2.25) nm and koff = (9.62 × 10⁻²⁸ ± 3.23 × 10⁻²⁶) s−1. For DNA20s the values are Δx = (2.89 ± 0.77) nm and koff = (8.11 × 10⁻¹⁴ ± 7.77 × 10⁻¹³) s−1.

