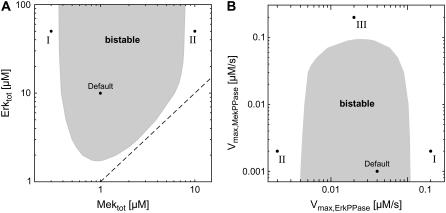
FIGURE 3.
Kinetic requirements for bistability. (A) Bifurcation diagram for alterations in kinase expression. The stimulus-response curves of the sequestration model were calculated for varying total Mek and Erk concentrations, and were then classified into monostable (white area) and bistable (gray area). The dashed line corresponds to equal Mek and Erk expression. Default indicates the parameter set given in Table 1. Point I indicates the situation where the Mek concentration is low relative to that of the Erk phosphatase, so that Erk activation is completely abolished. Point II corresponds to a cell that expresses high levels of Mek relative to Erk phosphatase. This provokes strong Erk activation before the Mek cycle is switched on, and therefore excludes coordinated activation of both kinases in a positive-feedback circuit. (B) Bifurcation diagram for alterations in phosphatase expression. Similar to A, but bistable behavior was analyzed for varying maximal velocities (i.e., varying expression) of the phosphatases that dephosphorylate Mek and Erk. See A legend above for explanation of points I and II. Point III indicates the situation where strong Mek-phosphatase expression necessitates high levels of active Raf to elicit Mek phosphorylation. Under these conditions, Mek is strongly sequestered by active Raf, and this abolishes hysteresis.

