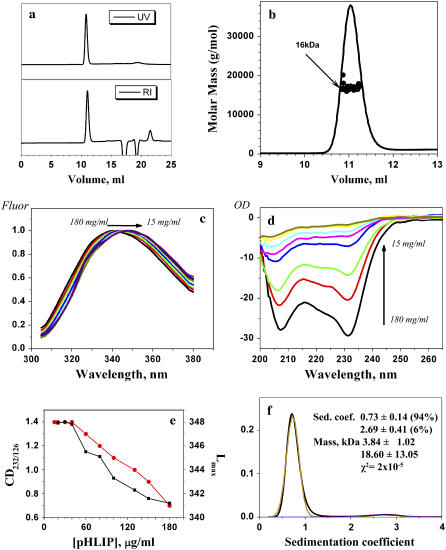
FIGURE 2.
pHLIP mass in solution at pH 8.0 studied by size-exclusion chromatography coupled with on-line laser light scattering, ultraviolet, and refractive index detection. (a) The UV and RI signals of the major fraction from the column. (b) The results of SEC-LS/UV/RI analysis revealed that the major fraction from the column contained tetrameric pHLIP. Normalized fluorescence (c) and CD (d) spectra of various concentrations of pHLIP measured in 10 mM phosphate buffer, pH 8.0. The emission spectra were measured at an excitation wavelength of 295 nm. The spectral maximum shifts from 341 to 348 upon dilution. At high peptide concentration, the CD spectra have a characteristic exciton pattern (minimum at 232 nm), which disappears at low concentration where the peptide adopts a random configuration. (e) The pHLIP concentration dependence in solution of the fluorescence maximum (red point and line) and the 232:126 nm ratio of the CD signal (black point and line). (f) The distribution of sedimentation coefficients (black line) obtained by analysis of sedimentation velocity runs obtained for 30 μg/mL of pHLIP in 10 mM phosphate buffer, 100 mM NaCl, pH 8.0 using the SEDFIT program. The distribution was fitted by Gaussian functions and two components were revealed (the theoretical line is red, the components are green and blue). One predominant component was found, corresponding to a peptide molecular mass of 3.84 kDa (molecular mass of the peptide is 4.1 kDa). Similar results were obtained by applying the SVEDBERG program (see text).

