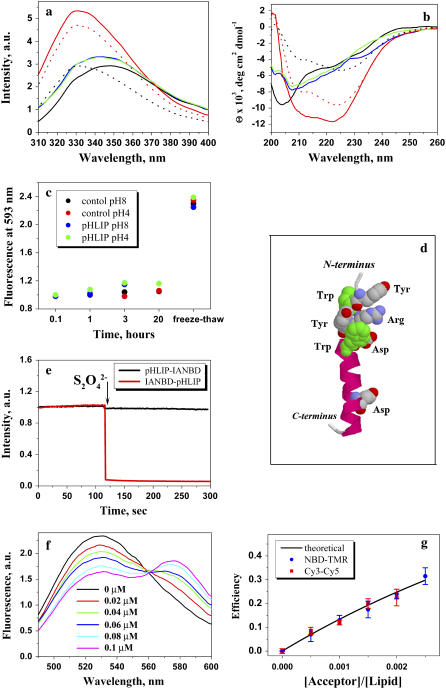
FIGURE 3.
Tryptophan fluorescence (a) and CD (b) spectra of 30 μg/mL pHLIP in 10 mM phosphate buffer in the absence and presence of POPC liposomes at various pHs. The fluorescence and CD spectra of pHLIP at pH 8.0 (black solid line) indicate a random configuration with tryptophan residues fully exposed to solvent. However, at low pH (pH 3.5) (black dotted line) the peptide tends to aggregate, leading to a shift of position of the fluorescence maximum and the appearance of some elements of secondary structure. Incubation of pHLIP with the POPC liposomes at pH 8.0 (blue solid line) induces the burial of tryptophan residues inside the lipid bilayer without helix formation. Decreasing the pH to 4.0 by the addition of HCl (red solid line) induces the insertion of pHLIP and the formation of helix. When POPC vesicles were added to the pHLIP at pH 3.5 there was an increase of fluorescence, a shift of the spectrum to short wavelengths, and an enhancement of helicity (red dotted line). The insertion of pHLIP across the lipid bilayer is a reversible process; an increase of pH leads to a loss of helicity and the release of the peptide from the membrane (green solid line). (c) The ability of pHLIP to induce vesicle fusion was tested on a mixture of two populations of vesicles with NDB and rhodamine fluorescently-labeled lipids. The graph presents the changes of rhodamine fluorescent signal during incubation of labeled vesicles in the presence of pHLIP at pH 8.0 and 4.0. The values were normalized to the rhodamine fluorescence (at 593 nm, excited at 450 nm) recorded after mixing of NDB-labeled liposomes with rhodamine-labeled liposomes in the absence of pHLIP. A significant increase of emission signal was observed only after several freeze-thaw cycles, which led to the fusion of vesicles. (d) An atomic representation of pHLIP taken from the crystal structure 1C3W (the C helix of bacteriorhodopsin) was generated by RasWin Molecular Graphics 2.6. The green are tryptophan residues. (e) The topology of pHLIP in a lipid bilayer was determined using the IANBD-dithionite quenching reaction. The fluorescence signal of IANBD attached to an SH group at the N-terminus (IANBD-pHLIP) or C-terminus (pHLIP-IANBD) of the peptide was monitored at 550 nm (excited at 478 nm). The starting point is a signal of IANBD-pHLIP and pHLIP-IANDB incubated with POPC followed by lowering the pH to 4.0. Then, dithionite was added. In case of IANBD conjugated to the C-terminus no change of signal is observed (black line), while the fluorescence of IANBD conjugated to the N-terminus of peptide is completely quenched (red line). The data indicate that the N-terminus of pHLIP stays outside, but that the C-terminus of pHLIP goes inside of the vesicles. (f) The pHLIP oligomeric state in a lipid bilayer was studied by FRET. The N-terminus of pHLIP was conjugated either with NDB or TAMRA. Fluorescence spectra of NDB were measured in the presence of an increasing concentration of TAMRA-pHLIP while keeping the total peptide and lipid concentration constant. (g) The comparison of calculated efficiency of energy transfer for NDB-TAMRA (blue points) and Cy3-Cy5 (red points) pairs with the theoretically predicted efficiency of energy transfer (black line) calculated from the Wolber-Hudson equation for noninteracting molecules.

