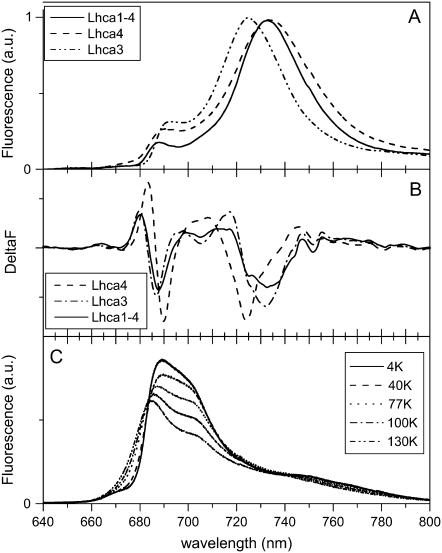
FIGURE 2.
(A) Emission spectra of Lhca3, Lhca4, and Lhca1–4 complexes at 4 K upon excitation at 506 nm. The spectra were normalized to the maximum. (B) Second derivative of the spectra in panel A. (C) Emission spectra of Lhca4-N-47H complex at different temperatures (4 K, 40 K, 77 K, 100 K, and 130 K), with 420 nm excitation.

