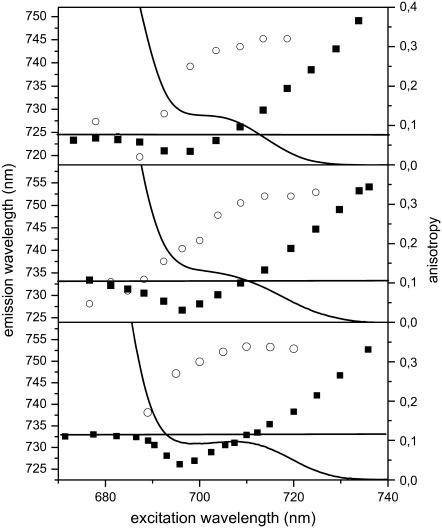
FIGURE 5.
Emission and absorption characteristics at 4 K of the red tail of (A) Lhca3, (B) Lhca4, and (C) Lhca1–4 complexes. (Solid squares) dependence of the emission maximum on the excitation wavelength. (Open circles) values of the anisotropy of the emission detected at the emission maximum (e.g., 725 nm for Lhca3, 733 nm for Lhca4, and 732.5 nm for Lhca1–4 dimer). (Line) red tail of the absorption spectrum at 4 K. The straight line represents the value of the emission maximum for nonselective excitation.

