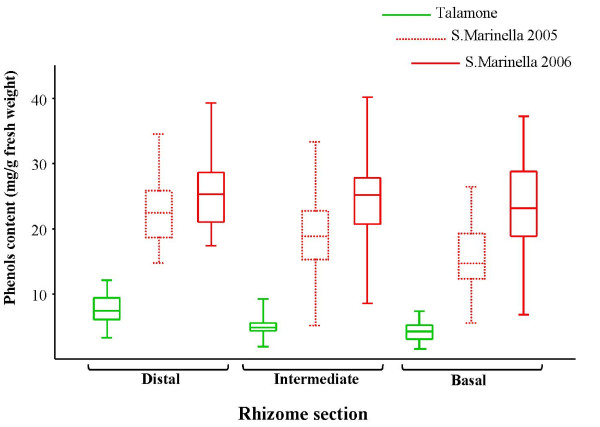
Figure 2.
Distribution of phenols content in rhizome distal, intermediate and basal sections. Phenols values (mg/g fresh weight) are represented as box-plots: the box contains 50% data (the extremes of that box are the Q1 and Q3, 1st and 3rd quartiles), the internal horizontal segments represent median of the distributions (Q2 value, 2nd quartile), 'whiskers' range from the lowest to the highest value. The box plots from S. Marinella meadow samples collected in 2006 (red, solid line) and 2005 (red, dotted line), and from Talamone meadow samples (green) are reported.

