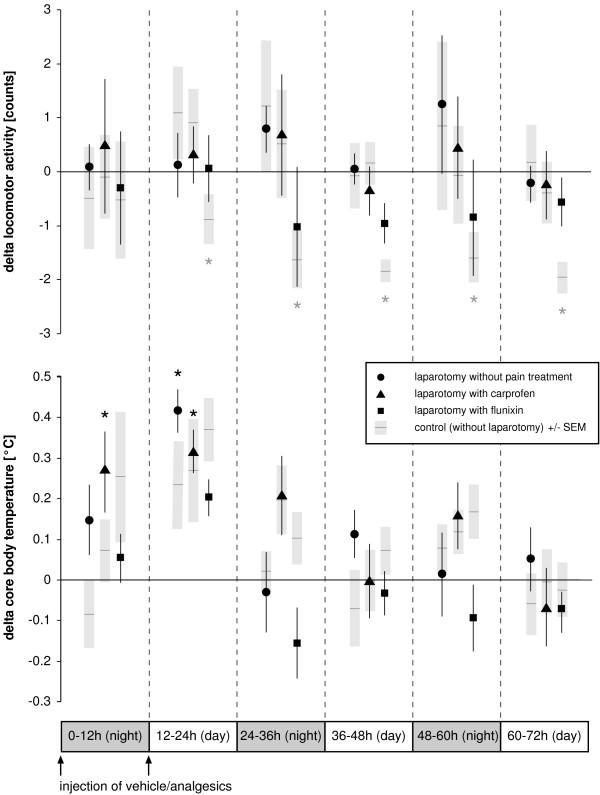
Figure 3.
Time course of locomotor activity and core body temperature following laparotomy. Changes (delta) in locomotor activity and core body temperature relative to baseline (i.e., normal values taken the day before the experiment) are plotted against time. Symbols represent 12-hour means (bars indicate ± SEM). Corresponding control experiments in which animals received anesthesia and injections only are depicted as black horizontal lines with grey columns representing ± SEM. Asterisks indicate statistical significance (n = 8, paired Student's t test with Bonferroni correction) at P ≤ 0.008.

