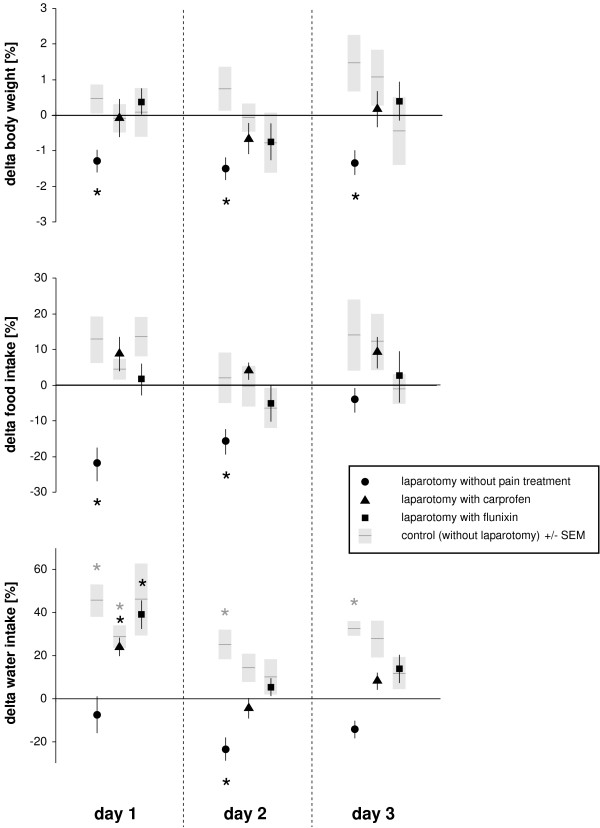
Figure 4.
Daily body weight, food and water intake. The percentage deviation (delta) from baseline of body weight, and food and water intake is presented. Symbols represent the mean values from 8 animals, with bars indicating ± SEM. Corresponding control experiments in which animals received anesthesia and injections only are depicted as black horizontal lines with grey columns representing ± SEM. Asterisks indicate statistical significance (paired Student's t test with Bonferroni correction) at P ≤ 0.016. Note the reduction in body weight for three days and the decrease in food consumption for two days after laparotomy without pain treatment.

