
Figure 8.
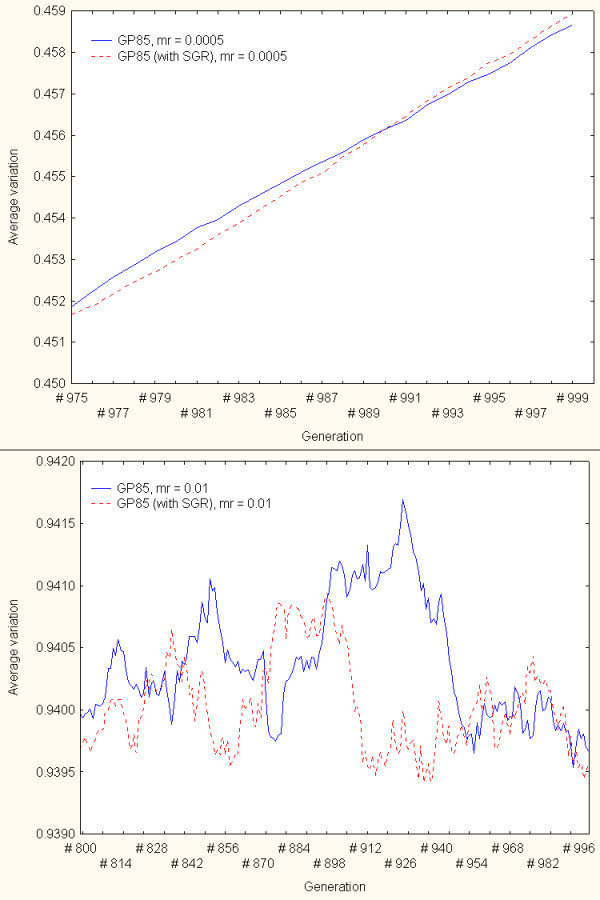
An exploration of the role of pseudogenes in variation generation – GP85 family. The continuous and dotted-line curves represent the simulation results from variation generation models based on intra-family gene sequence exchange only (pseudogenes were not included in the gene conversion events) and through gene conversion with pseudogenes (with SGR), respectively. The upper panel displays results when the simulations were conducted with mr = 0.0005. The lower panels shows a close-up view of results under mr = 0.01.