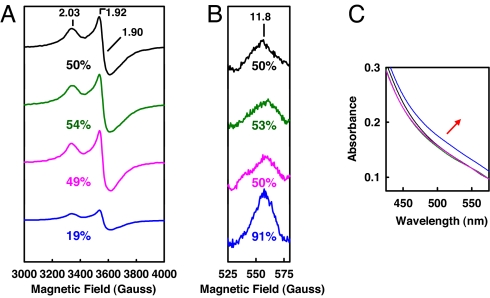
Fig. 5.
Perpendicular-mode EPR spectra (A), parallel-mode EPR spectra (B), and visible-range absorption spectra (C) of Av1ΔnifZΔnifB(0) (black lines), Av1ΔnifZΔnifB(+NifZ) (green lines), Av1ΔnifZΔnifB(+Av2/ATP) (pink lines), and Av1ΔnifZΔnifB(60′) (blue lines). EPR and visible-range absorption spectra were measured at protein concentrations of 10 and 5 mg/ml, respectively, as described in Materials and Methods. The time-dependent change of the visible-range absorption spectra during P-cluster maturation is indicated by the red arrow. The g values of the EPR spectra are indicated. The perpendicular (B) and parallel-mode EPR signals (C) are integrated as percentages of that of Av1ΔnifZΔnifB(0) (set as 50%).

