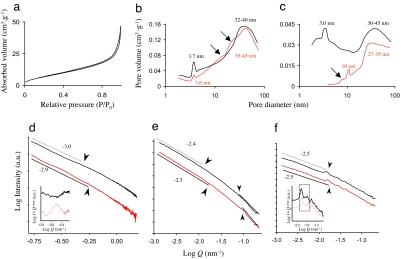
Fig. 2.
Overview of data obtained from N2-sorption/desorption analysis (Upper) and USAXS studies (Lower) on biosilica obtained from the diatoms T. punctigera and T. weissflogii. The black and red lines represent data of high and low salinity, respectively. (a) Sorption/desorption isotherm for T. weissflogii, with a narrow hysteresis loop, which is typical for mesoporous diatom biosilica (23). (b and c) BJH plots of the relative pore volume contributions of dominant well defined pores of T. weissflogii and T. punctigera. (d and e) SAXS and USAXS spectra of T. weissflogii. (f) USAXS spectrum of T. punctigera, showing distinct straight regions (some of which are indicated by a gray line) and typical transition points (arrowheads) between such regions. (d and e Insets) Oscillation patterns, after correction of descending (U)SAXS spectra.

