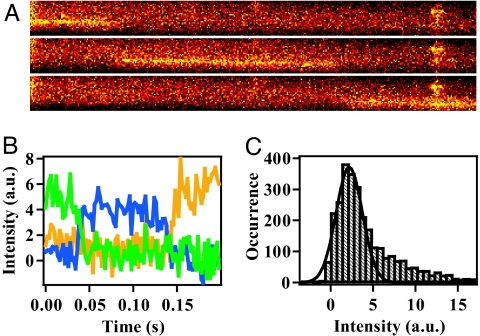
Fig. 2.
Examples of the fluorescence data from single molecules of G-Alexa dissolved in the buffer containing 4 M Gdm. (A) Typical images of the fluorescence traces from a single G-Alexa flowing inside the capillary. The excitation laser power was 600 mW. The images were recorded consecutively with an exposure time of 100 ms. The background intensity was not subtracted. (B) The time evolution of the fluorescent intensity from the single G-Alexa converted from the raw data presented in A. The residence time of one data point was adjusted to 2 ms per point. The green, blue, and yellow traces correspond to the time evolution converted from the upper, middle, and bottom images in A, respectively. (C) Intensity histogram of the fluorescence from single molecules of G-Alexa. The fluorescent intensities recorded from 73 images were plotted. The residence time of one data point of the traces was 2 ms per point. The black line shows the single Gaussian function fitted to the observed distribution with an average intensity of 2.17 and a standard deviation of 1.55.

