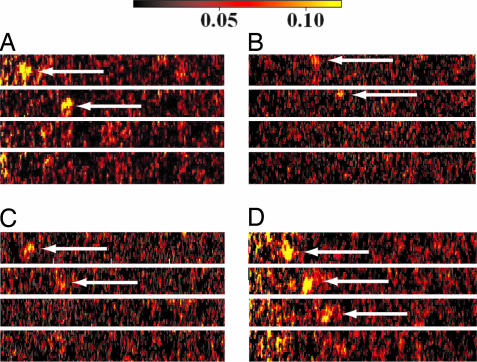
Fig. 3.
Photobleaching of G-Alexa observed at the single-molecule level. The exposure time for each panel was 10 ms, and the interval between adjacent panels was ≈30 ms. The single fluorescence spots of G-Alexa are indicated by the arrow. The fluorescence spot suddenly disappeared in a single step. Intensities are represented in color scaling from black to yellow. The fluorescence intensity was normalized by using the standard solution of G-Alexa.

